
The Utilization Dashboard in Hapax gives admins valuable insight into how their team is using the platform. This dashboard highlights usage trends over time, breaks down the types of questions being asked, and offers detailed engagement metrics per employee. While you won’t be able to see the exact wording of the questions asked, you’ll still get a clear picture of how your team is interacting with Hapax and where they’re finding value.
Step 1) Log In and Navigate to Reports
Start by logging into your account on the platform using your credentials. Once you're on the main dashboard, head to the left-hand side and select the Reports icon. This will open up your Reports Dashboard.

Step 2) Explore the Utilization Dashboard

Inside the Utilization Dashboard, you are able to navigate the dashboard by Daily Usage, Weekly Usage, Monthly Usage, or select the dates that you would like to focus on.

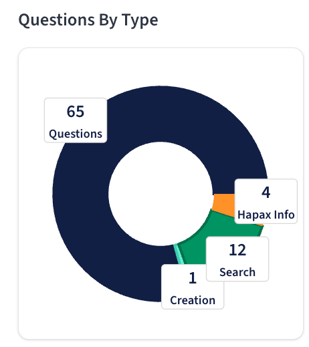
Questions By Type showcase the total number of questions asked during the time period and the types of inquiries that Hapax received. This can include:
- Questions: Questions asked to Hapax were general questions
- Creation: Inquiries through the Chat were asking to create a document, policy, procedure, etc.
- Search: Inquiries through Hapax where the user was trying to find a document
- Hapax Information: Users were asking Hapax, Hapax related questions. For example: “How do I edit a document in Hapax?”
Navigate Employee Usage by selecting any of the following to receive the information as ascending or descending order.
Name: Is the name of the employee, can be organized by alphabetical order
Last Active: The last time the employee logged into Hapax. This can be looking through a past chat session or utilizing the information vault.
Latest Question: The last time an employee has asked a question in Hapax.
Questions Asked: This is the number of questions asked given the time period.
Avg Questions Per Day: This is the average amount of questions asked per day for the user given the time period.

Step 3) Downloading Dashboard Information
Download the Utilization Report by selecting either the Download Dashboard. This pdf document will be able to show you the Utilization Dashboard from the time period that you selected. 
Or you can download Employee Usage as a CSV, by selecting Download CSV

Step 4: Done!
You’ve successfully navigated the Utilization Dashboard! You now have access to key usage metrics that can help guide adoption and identify trends across your team. Keep in mind, this dashboard is only available to admins—and while you can’t see the exact questions asked, the categorized data provides meaningful insights into how Hapax is being used across your organization.